Dashboards › Executive Summary
Group Performance Overview — Q2/H1 2026
Profit after tax (PAT) grew by 12% year-on-year to ₦292.27 billion, demonstrating the Group's resilience and ability to deliver earnings growth despite lower revenue. Consequently, the PAT margin improved to 38%, compared with 29% in H1 2025, reflecting the positive impact of disciplined cost management, improved operating efficiency, and stronger overall profitability.
Revenue by Division — H1 Actual vs Prior Year vs Budget ₦ billions
Revenue Mix H1 2026 share of ₦765.1bn
Revenue Bridge — H1 2025 → H1 2026 volume −5% · avg. price −14%
A 14% average selling price reduction implemented in response to prevailing market conditions (−₦105.1bn) combined with a 5% volume decline (−₦42.3bn). Pasta bucked the trend with 35% revenue growth.
Division Scorecard — H1 2026
| Division | Volume MT | Revenue ₦bn | YoY | GP margin | Budget achievement |
|---|---|---|---|---|---|
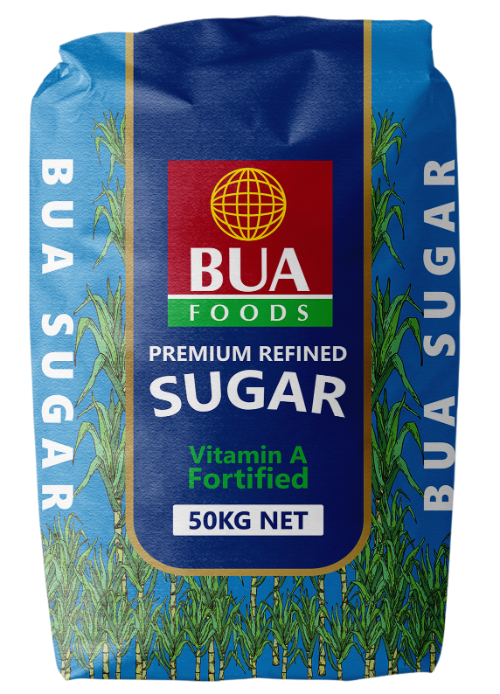 Sugar Sugar | 266,145 | 327.0 | −18% | 53% | |
 Flour Flour | 256,860 | 276.2 | −27% | 46% | |
 Pasta Pasta | 126,442 | 130.6 | +35% | 43% | |
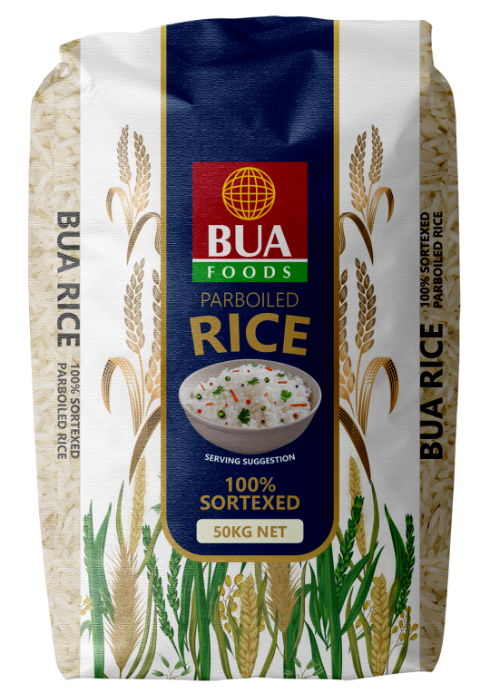 Rice Rice | 30,399 | 31.3 | −20% | 32% | |
| Group | 679,844 | 765.1 | −16% | 47.5% |
Revenue budget achievement: Sugar 88% · Flour 81% · Pasta 128% · Rice 66% · Group 89%. Pasta exceeded budget on sustained demand and the distributors self-collection initiative.
Q3 / H2 / FY 2026 Forecast board financial forecast · ₦bn
| Item | H1 2026 actual | Q3 2026 forecast | H2 2026 forecast | FY 2026 forecast | FY 2025 actual | FY growth |
|---|---|---|---|---|---|---|
| Volume (tons) | 679,844 | 394,279 | 804,265 | 1,484,064 | 1,466,550 | +1% |
| Revenue | 765.1 | 402.9 | 791.5 | 1,556.6 | 1,774.6 | −12% |
| Gross profit | 363.2 | 191.3 | 375.8 | 739.0 | 737.3 | 0% |
| Operating profit | 320.5 | 168.8 | 331.6 | 652.1 | 656.6 | −1% |
| Profit before tax | 314.9 | 165.4 | 325.3 | 640.6 | 521.5 | +23% |
| Profit after tax | 292.3 | 153.5 | 302.0 | 594.6 | 518.4 | +15% |
Operating Environment & Key Activities click for full detail
- Q2 milestones: ERP go-live at Apapa · Sales app launched on Play Store/iOS · sales team organisation expanded · Lagos distribution centre acquired · 15 AGTTP trainees onboarded · IRS 3 erection commenced (Port Harcourt).
- Macro: Naira appreciated 4.3% YTD (reserves > $50bn); inflation peaked at 15.93% in May; US–Israel/Iran conflict pushed crude above $100/bbl.
- Competition: FMN dealer conference & ₦4bn reward drive; Olam launched Mama's Choice flour, Mama's Pride semolina & edible oil; Dangote sustaining trade credit support.
- Investor relations: share price ₦939 (+18% YTD, target ₦1,000); market cap ₦16.9tn; shareholders 59,891 (+85% YTD).
- Q3 focus: ₦402.9bn revenue / 394,279 tons forecast · ERP Port Harcourt go-live · HRIS & CRM implementation · Lagos DC activation · LASUCO priorities.
Raw Sugar Receipts — Vessels Received, H1 2026 sugar division board reports
| Vessel | Material | Discharge | Arrival | Qty (MT) |
|---|---|---|---|---|
| MV Yaba Tokyo (balance) | Raw sugar | Lagos refinery | Jan | 21,760 |
| MV Arcadia | Raw sugar | Lagos refinery | Jan | 38,215 |
| MV Siroco | Raw sugar | PH refinery | Jan | 33,638 |
| MV Sea Pearl | Raw sugar | PH refinery | Feb | 39,935 |
| MV Ken Wave | Raw sugar | Lagos refinery | Mar | 44,905 |
| MV Sea Pearl (2nd call) | Raw sugar | PH refinery | Apr | 41,612 |
| MV Tremola | Raw sugar | PH refinery | Apr | 39,438 |
| MV RB Dylan | Raw sugar | PH refinery | May | 35,930 |
| Total received | 8 vessels | 295,433 |
All three Q2 cargoes (116,980 t) discharged at Port Harcourt — no Lagos raw-sugar vessel in Q2. No brown-rice vessel in H1: rice exhausted the Q4 MV Akson Meisa cargo in Q1 and halted milling; imported Indian rice began loading in July 2026.
Raw Sugar Receipts by Month MT discharged · H1 2026
Sources: H1 2026 finance report for board meeting (July 2026); unaudited consolidated financial statements (6M to 30 Jun 2026, approved 29 Jul 2026); Q2/H1 2026 executive management board report — volumes, budgets and divisional margins per board presentation.
Dashboards › Sales
Sales Performance — Four Core Divisions
Sales Volume by Division metric tons · H1 2025 vs H1 2026
Budget Achievement by Division actual revenue vs budget · 100% line = budget
Top SKUs by Division unaudited product-level revenue · Note 1 · H1
| SKU / Product line | Division | H1 2026 ₦bn | H1 2025 ₦bn | YoY |
|---|---|---|---|---|
| Fortified Sugar | Sugar | 258.0 | 303.8 | −15.1% |
| Bakery Flour | Flour | 257.2 | 352.1 | −27.0% |
| Pasta (Spaghetti) | Pasta | 130.6 | 96.9 | +34.7% |
| Non-fortified Sugar | Sugar | 68.4 | 93.7 | −27.0% |
| Head Rice | Rice | 31.2 | 37.5 | −16.8% |
| Wheat Bran | Flour | 18.1 | 21.2 | −14.7% |
 Semolina Semolina | Flour | 0.95 | 1.23 | −23.1% |
| Molasses | Sugar | 0.62 | 0.57 | +9.9% |
| Rice Bran / Maize / Paddy | Other | 0.11 | 5.47 | −98% |
Pricing & Demand Notes H1 2026 finance report
- Group: 14% average selling price reduction in response to prevailing market conditions; volume down 5%. Contribution margin improved to 47% (37% H1 2025).
- Sugar (−9% vol): weaker demand; 11% ASP decrease. Contribution margin up to 53% (41% PY).
- Flour (−19% vol): weakened product demand; 9% ASP decrease. Contribution margin 46% (33% PY) on supply-chain efficiencies.
- Pasta (+66% vol): strong demand, market penetration drive and distributors self-collection initiative; 128% of revenue budget.
- Rice (+7% vol): 21% ASP reduction more than offset volume growth; revenue −20%, budget achievement 66%. Q2 sales constrained by raw-material stockout.
Average Realised Price ₦m per MT · computed · H1
Order Generation — H1 2026 769,172 tons (−6%) · ₦786.3bn (−13%) · board report §4a
| SKU | H1 2026 vol (tons) | H1 2026 val ₦bn | H1 2025 vol | Vol Δ | Val Δ |
|---|---|---|---|---|---|
| Sugar 50kg | 265,503 | 334.6 | 262,518 | +1% | −17% |
| Flour | 256,883 | 247.8 | 333,317 | −23% | −33% |
| Pasta | 134,220 | 148.9 | 54,352 | +147% | +114% |
| Bran | 60,985 | 12.0 | 124,566 | −51% | −40% |
| Head Rice | 25,470 | 25.9 | 28,696 | −11% | −23% |
| Macaroni | 11,614 | 9.1 | 5,914 | +96% | +29% |
| Molasses | 8,096 | 0.4 | 4,444 | +82% | +13% |
| Sugar 25kg (new) | 4,718 | 6.2 | — | new SKU | new |
| Total orders | 769,172 | 786.3 | 819,283 | −6% | −13% |
Also in H1: head rice 25kg 715 t (new), semolina 5kg 219 t (−77%), semolina 1kg 455 t (−18%), rice bran 293 t (−92%).
Customer Base — Q2 2026 customer demographics · board report §4f
- Strongest regions: South South at 86% active (14 new customers); North East 77%; Corporate II / Corporate III 75%.
- Weakest: North Central at 55% active and North West II at 59% (0% enrollment) — regional re-engagement strategy required.
- Greater South: H1 closed at 56% of annual target with +4% volume YoY; 82% sales strike rate. Pasta +229% YoY; rice sales suspended on stockouts.
Dashboards › Production
Production & Plant Operations
Sugar Refinery Throughput tons · H1 2026 · raw sugar received 295,433 t
Flour & Pasta Mills — Output by Product tons · IRS 1 + IRS 2 combined · H1
Monthly Refinery Output (RSO) tons · sugar division board report · H1 2026
Lagos dipped sharply in April (4,674 t) during the Turn Around Maintenance before recovering to 11.9–13.4k t/month; Port Harcourt strengthened through Q2 to 30.2k t in June.
Refinery Downtime Analysis — Q2 hours · click for breakdown
| Cause | Lagos hrs | % | PH hrs | % |
|---|---|---|---|---|
| Refinery equipment | 435.2 | 100% | 78.8 | 12.7% |
| Gas supply | 0.0 | 0% | 46.3 | 7.5% |
| Insufficient trucks | 0.0 | 0% | 273.6 | 44.1% |
| Others | 0.0 | 0% | 221.4 | 35.7% |
| Total downtime | 435.2 | 100% | 620.2 | 100% |
Lagos losses were entirely equipment-driven (dryer heat exchangers, FA600.3 vibration, boiler tube failures) during the TAM; PH's biggest loss was truck availability for sugar evacuation (44%).
Mill Utilisation — Flour & Pasta Lines % of 2,184 available hours · Q2 2026
Mill Downtime — Q2 2026 % of available hours · click for full mill detail
| Driver | IRS 1 flour | IRS 2 flour | IRS 1 pasta | IRS 2 pasta |
|---|---|---|---|---|
| Less sales | 18.6% | 17.9% | 16.7% | 25.3% |
| Raw material stock-out | 4.4% | 13.7% | 13.2% | 19.8% |
| Plant maintenance | 1.4% | 2.3% | 12.6% | 12.9% |
| Generator / other | 4.8% | 1.1% | 13.9% | 1.7% |
| Total downtime | 29.2% | 35.0% | 56.4% | 59.6% |
Group F&P downtime ran at 31% of available hours in Q2. Flour downtime remains demand-led (“less sales”), with raw-material stock-outs now the second driver; pasta lines lost over half their hours across demand, stock-outs and maintenance.
Sustainability — ESG Metrics Q2 2026 vs Q2 2025 · board report §6b
| Indicator | Q2 2025 | Q2 2026 | Target | Status |
|---|---|---|---|---|
| GHG emission (kg CO₂/ton) | 109 | 136 | 251 | On target |
| Water use (m³/ton) | 3.14 | 4.49 | 3.51 | Above target |
| Noise level (dB) | 82 | 81 | <90 | On target |
| Air quality (ppm) | 0.21 | 0.19 | <0.50 | On target |
Water intensity breached target in Q2 — the one red ESG metric. H1 highlights: ₦95.4m social investment (90 MT of BUA Rice donated to Rivers & Ondo States); ARSO Quality Mark for BUA Sugar Lagos & BUA Rice Kano; 2025 Sustainability Report completed.
Quality & Certifications Q2 2026 · quality systems update
- Customer complaints: BUA Sugar Lagos — high colour at 90–110 IU (pilot trials achieved 85 IU average). IRS Flour, IRS Pasta, BUA Rice, BUA Semolina — nil.
- Milestones: NAFDAC certification for BUA RAHA Rice; SMETA 4-Pillar; BONSUCRO membership; SON MANCAP; Halal revalidation (CAPA submitted, certificate renewal pending).
- Audits: Coca-Cola SGP & technical audits completed at PH; ISO 9001/14001/45001 & FSSC 22000 internal audit due July; FSSC 22000 v6 external audit due August 2026.
- In progress: BUA Premium Refined Sugar NAFDAC renewal, BONSUCRO Chain of Custody, EcoVadis compliance.
Mill Production Summary — Q2 2026 tons · board report §5b
| Product | IRS 1 | IRS 2 | Q2 2026 total | Q2 2025 | Growth |
|---|---|---|---|---|---|
| Bakers flour | 53,397 | 83,825 | 137,222 | 156,813 | −12% |
| Pasta flour | 29,416 | 28,654 | 58,070 | 39,735 | +46% |
| Spaghetti (slim + premium) | 28,574 | 23,096 | 51,670 | 40,538 | +27% |
| Macaroni cavatto | — | 3,397 | 3,397 | 2,444 | +39% |
| Bran (by-product) | 19,966 | 26,808 | 46,774 | 80,858 | −42% |
| Semolina | — | 446 | 446 | 973 | −54% |
| Aggregate production | 111,387 | 139,418 | 250,805 | 240,502 | +4% |
IRS 1 aggregate +37% YoY; IRS 2 −12%. Q2 milestones: 2nd pellet line commissioning completed; IRS 3 structural works commenced at Port Harcourt; zero regulatory fines, fire incidents or fatalities.
Plant Notes — Q2 2026 click a plant for achievements & challenges
| Plant | Output (t) | Processed (t) | Status highlights |
|---|---|---|---|
| Sugar — Lagos | 29,950 | 33,788 | Turn Around Maintenance |
| Sugar — Port Harcourt (FZE) | 83,090 | 87,681 | Truck availability |
| Flour & Pasta — IRS 1 & 2 | 250,805 | 245,193 | 2nd pellet line commissioned |
| Rice — Kano | 0 | — | Raw material depleted |
HSE Scorecard Q2 2026 vs Q2 2025 · all targets met
| Indicator | Q2 2025 | Q2 2026 | Target | Status |
|---|---|---|---|---|
| Lost time injuries | 4 | 0 | <5 | Zero |
| Fatalities | 0 | 0 | 0 | Zero |
| Near misses | 3 | 3 | <30 | On target |
| Medical treatment | 6 | 1 | <10 | Improved |
LASUCO Sugar Project — Completion Tracker Q2 2026 · click for full work log
Q2: SHIRJEE contract signed — first installation batch arrived on site 8 July; CLM 4,000 ha land-development contract signed (awaiting payment); CBMI roads/bulk-water/dyke contract signed and work started; first 50 GRP bulk-water pipe containers delivered; 200 ha nursery preparation ongoing.
Q3 2026 Production Priorities board report key plans
- Sugar Lagos: commission DBF and Silver Weibull centrifugal machines; commission new air compressors & dryers; Boiler 2 refurbishment; 10 MW expansion bellow replacement; bagging machine upgrades.
- Sugar Port Harcourt: turbine PLC panel commissioning & full-load trial; Cooling Tower Cell No. 2 and Perkins DG; replace air dryer & RO membranes; commission high-capacity exhaust fans.
- Flour & Pasta: commission precleaning plant; install human lift; commence premium-quality pasta trials; FSSC 22000 v6 external audit (August).
- Rice: complete RCC roads, culverts, truck parking & weighbridge infrastructure; commission 2 new sortex lines; launch consumer packing line & 5 kg SKU.
- LASUCO: release funds for farm equipment; 10% CLM advance payment; finalise electrical & automation project; UPVC pipe supplier negotiation; floating pump station for 200 ha nursery.
Sources: Q2/H1 2026 Executive Management Report — divisional operations (§5), LASUCO update (§1), quality systems & responsible operations (§6b); LASUCO Q2 2026 progress report.
Dashboards › Finance
Finance Overview — Q2/H1 2026
Margin Expansion — H1 2025 vs H1 2026 % of revenue
Cost of Sales Composition ₦bn · Note 2 · H1
Balance Sheet Ratios vs Industry Threshold 30 Jun 2026 vs FY 2025
Current ratio 1.9× and quick ratio 1.8× both well above industry thresholds (1.3× / 1.0×); leverage continues to fall — debt-to-equity 0.7 (0.9 FY25), debt-to-asset 0.4 (0.5 FY25).
Financial Position Summary ₦bn · vs FY 2025
| Line item | 30 Jun 2026 | FY 2025 | Δ |
|---|---|---|---|
| Total assets | 1,671.2 | 1,387.8 | +20% |
| — Current assets | 1,266.0 | 993.4 | +27% |
| — Non-current assets | 405.2 | 394.4 | +3% |
| Total equity | 1,005.7 | 713.4 | +41% |
| Total liabilities | 665.5 | 674.3 | −1% |
| Total borrowings (incl. overdraft) | 343.2 | 391.7 | −12% |
| Cash & short-term deposits | 149.5 | 56.4 | +165% |
| Net debt | 193.7 | 335.3 | −42% |
Equity growth driven by retained earnings (₦997.7bn, +41%). Cash build reflects ₦162.2bn operating cash flow, ₦103bn placed in short-term investments and lower capex (₦15.8bn vs ₦58.9bn H1 2025); ₦88.6bn of borrowings repaid.
Operating Expenses ₦bn · H1 vs prior year and budget
Selling & distribution fell 15% to ₦30.4bn; administrative expenses fell 25% to ₦14.5bn. Total overheads of ₦44.9bn were 18% below H1 2025 but 6% over the ₦42.5bn budget; overhead margin held at 6% of revenue. Q2 overheads ₦23.4bn (−28% YoY, 10% over budget).
Divisional Profitability PBT ₦bn and margin · H1 · finance report
Margin expansion across core divisions: Sugar PBT margin 45% (34% PY), Flour 40% (26%), Pasta 37% (31%), Rice 26% (35% — the only decline). Group PBT ₦314.9bn.
Dashboards › Distribution
Distribution & Deliveries
Deliveries by Product — Q2 Actual vs Budget vs Prior Year tons · customer shipment summary
Delivery Summary — Q2 2026 tons · click for detail
| Product | Q2 2026 | Budget | vs PY | vs Budget |
|---|---|---|---|---|
| Sugar — Lagos | 62,947 | 75,000 | +9% | 84% |
| Sugar — FZE | 68,048 | 75,000 | +6% | 91% |
| Flour | 163,481 | 150,000 | −2% | 109% |
| Pasta | 55,203 | 54,000 | +28% | 102% |
| Rice | 15,892 | 40,500 | −40% | 39% |
| Macaroni | 3,503 | 3,375 | +39% | 104% |
| Semolina | 345 | 675 | −47% | 51% |
| Total shipped | 369,420 | 398,550 | +2% | 93% |
H1 shipments 682,748 t — down 1% YoY, 86% of budget (board report §4c). Sugar FZE exports: 540 t in Q2, 2,790 t H1 (22,500 t H1 2025). Rice deliveries constrained by the raw-material stockout.
Orders Fill Rate — Q2 2026 sales delivery vs processed orders · board report §4e
Rates above 100% reflect backlog cleared from opening orders (flour, bran). Spaghetti closed Q2 with an 18,770 t open-order backlog (66% fill) — the key service-level gap.
Warehouse Stock Distribution % of stock value · illustrative pending ERP integration
Delivery Achievement by Product % of budget · Q2 2026 · 369,420 tons total (93%)
Truck Fleet Performance no due update in Q2 · Q1 2026 monthly average vs benchmark · §6a
| Indicator | Q1 2026 avg | Benchmark | Status |
|---|---|---|---|
| Average trips per truck | 1.9 | 3.0 | −37% below |
| Average KMs per truck | 4,054 | 4,000 | On benchmark |
| Average KM per litre | 1.65 | 1.50 | +10% better |
| Trucks used / available | 81% | 90% | 9 pts below |
Board report §6a reported no due truck-performance update for Q2 — Q1 averages shown. Truck availability remained the largest refinery downtime driver at Port Harcourt in Q2 (44% of hours lost).
Dashboards › Material Supply Chain
Material Supply Chain
Stock Receipts & Goods Inward — Q2/H1 2026 click for detail
| Material | H1 2026 receipts | Status |
|---|---|---|
| Raw sugar (Lagos + PH refineries) | 295,433 t | 8 vessels · Q2 cargoes all to PH |
| Wheat (hard & durum, IRS mills) | 485,227 t milled | Q2 grinding 245,193 t (−14% YoY) |
| Goods in transit | ₦2.1bn | Down from ₦14.2bn FY25 — landed |
| Brown rice (imported) | 0 t | Stock at zero — Indian rice loading Jul 26 |
| LASUCO — GRP pipes & SHIRJEE equipment | 50 containers | First SHIRJEE install batch on site 8 Jul |
No Lagos raw-sugar vessel in Q2 (Turn Around Maintenance); Port Harcourt received MV Sea Pearl 41,612 t, MV Tremola 39,438 t and MV RB Dylan 35,930 t. Full 8-vessel H1 manifest on the Executive Summary.
Supplier Performance Scorecard strategic suppliers · illustrative
| Supplier | Category | OTIF | Quality | Lead time | Score |
|---|---|---|---|---|---|
| Raw Sugar — Brazil JV | Sugar | 96% | 99.2% | 38 d | |
| Hard Wheat — Black Sea | Flour | 92% | 98.1% | 31 d | |
| Durum Wheat — CAN/EU | Pasta | 88% | 98.8% | 35 d | |
| Paddy Aggregators — NG | Rice | 81% | 95.4% | 9 d | |
| Packaging — local film & kraft | All | 94% | 97.6% | 12 d |
Inventory Composition ₦bn · 30 Jun 2026 vs FY 2025 · Note 7
Working Capital Position ₦bn · 30 Jun 2026 vs FY 2025
Receivables fell to ₦43.0bn (₦101.9bn FY25) on lower prepayments and other receivables; cash more than doubled to ₦149.5bn. No inventory write-downs in the period and none pledged as loan security.
Stock Health by Division illustrative operating view pending ERP integration
| Division · Material | On hand (tons) | Safety (tons) | Status | Cover |
|---|---|---|---|---|
| Sugar — raw sugar | 106,300 | 85,000 | Healthy — Q2 cargoes all at PH | 5.4 wks |
| Flour — wheat | 98,700 | 95,000 | Watch — Q2 stock-outs hit mills | 4.9 wks |
| Pasta — durum/semolina | 26,100 | 32,000 | Watch — demand surge | 2.9 wks |
| Rice — brown rice | 0 | 15,000 | Stock-out — mill idle in Q2 | 0 wks |
| Packaging & consumables | — | — | ₦5.6bn (−15%) | 4.0 wks |
Rice raw material fully depleted since Q1 — imported Indian rice began loading in July 2026. Raw-material stock-outs also cost the flour mills 4–14% of available hours in Q2.
Inventory Flow Notes H1 2026 · Note 7
- Raw materials ₦26.2bn (−20% vs FY25): raw-material cost per MT down 30% YoY on improved sourcing efficiency.
- Work in progress ₦10.3bn (+359%): higher in-process stock supporting the pasta output drive.
- Finished goods ₦7.0bn (−73%): sharp sell-down of finished stock — the main driver of the inventory reduction.
- Goods in transit ₦2.1bn (−85%): FY25 in-transit stock landed — a sustained working-capital release.
- Energy & consumables ₦5.6bn (−15%): energy cost per MT down 3% YoY.
- No write-downs recognised in the period; no inventories pledged as security.
Sales Volume vs Prior Year by Division metric tons · H1 2026
Implied Capacity Utilisation H1 volume vs installed capacity ÷ 2 · computed
Installed capacity per AR 2025: Sugar 1.5m · Flour 1.5m · Pasta 0.5m · Rice 0.2m MTpa. Pasta remains the most utilised line at 51% — IRS 3 expansion works commenced at Port Harcourt in Q2.
Unit Economics by Division H1 2026 · computed from finance report
| Division | Volume MT | ASP ₦m/MT | ASP Δ YoY | GP margin | EBITDA margin |
|---|---|---|---|---|---|
| Sugar | 266,145 | 1.23 | −11% | 53% | 47% |
| Flour | 256,860 | 1.08 | −9% | 46% | 41% |
| Pasta | 126,442 | 1.03 | −19% | 43% | 37% |
| Rice | 30,399 | 1.03 | −21% | 32% | 27% |
Despite price reductions across the board, cost of sales per ton fell 26–27% in Sugar, Flour and Pasta (Rice −16%), expanding gross margins in every division except Rice's EBITDA line.
Risks & Management Focus Q2 2026 outlook · board report §8
- Elevated input costs: raw material & packaging costs remain high on exchange-rate pass-through, though rising more slowly than 2024–25.
- Energy & utilities: petrol and diesel at historically elevated levels; crude above $100/bbl on the US–Israel/Iran conflict.
- Weak consumer purchasing power: higher price sensitivity, shift toward lower-cost alternatives.
- FX & import dependence: volatility reduced (Naira +4.3% YTD) but imported inputs still costly; access to FX challenging in instances.
- Supply chain & logistics: poor transport infrastructure, high haulage charges and longer inbound lead times.
- Q3 focus: cost optimisation, demand management & product-mix, supplier diversification, regulatory monitoring, energy alternatives.